Intrusion Detection Lab Guide: Snort and Pattern Detection
Setup
For this lab we need to VMs you can find them in your weekly folder Week-9:
Victimto do all the work (collecting traffic and generate rules) o- Username:
victim, password:victimvm
- Username:
Adminto test some rules and to generate traffic- Username:
csf_vm1, password:kalivm1.
- Username:
Part1: Understanding Snort
Section 1: Understanding Snort and Its Purpose
1. What is Snort?
Definition: Snort is an open-source Network Intrusion Detection System (NIDS) designed to monitor network traffic in real time, identify suspicious patterns, and generate alerts for potentially malicious activities.
- Applications: Snort can be used for multiple purposes, such as:
- Real-time traffic monitoring and packet analysis.
- Alerting on potentially harmful activity based on defined rules.
- Acting as an Intrusion Prevention System (IPS) when configured with active blocking.
3. How Snort Works
Basic Components:
-
Packet Decoder (Sniffer): Reads raw network traffic and passes it to the preprocessor.
-
Preprocessor: Normalises packets (e.g., fragments reassembled) and prepares them for inspection.
-
Detection Engine: Applies Snort rules to identify suspicious patterns.
-
Logging and Alerting (output): Logs detected events and generates alerts based on configured rules.

Example Workflow: A packet enters the network, passes through Snort’s decoder, is inspected by various preprocessors, matched against Snort rules, and if a rule matches, it’s logged and an alert is generated.
4. Key Snort Terminology
- IDS (Intrusion Detection System): A system designed to detect malicious activity on a network.
- Rule: A specific instruction for detecting network patterns, like recognising a certain type of packet or a sequence of packets.
- Alert: A notification generated by Snort when it detects activity matching a rule.
- Packet: A unit of data routed between an origin and a destination in a network.
- TCP/UDP/ICMP: Common network protocols Snort can inspect.
- Preprocessor: A module in Snort that processes packets to make detection more effective (e.g., normalising fragmented packets).
5. Snort Operating Modes
Overview of Modes:
- Sniffer Mode: Captures and displays network traffic in real time, like a basic packet sniffer.
- Packet Logger Mode: Records network traffic to a log file, enabling later analysis.
- Intrusion Detection Mode: Monitors network traffic in real time and checks for suspicious activity based on defined rules.
Activity:
-
For each mode, explain when it might be used in real-world scenarios?
Click to view possible answers
-
Sniffer Mode: Quick traffic inspection or debugging network issues.
-
Packet Logger Mode: Collecting data for forensic analysis.
-
Intrusion Detection Mode: Monitoring a network for active threats.
-
Section-2: Working with Snort (on the Victim Machine, please)
I highly recomand to do your lab on an UBUNTU machine and not Kali this time.
Snort is already installed on your lab vm, but if you're using your own machine please using this to install it:
sudo apt install snort
-
Verify Installation:
snort --version -
File and Directory Structure:
- Explain key configuration files:
- snort.conf or snort.lua (if you're using Kali): The main configuration file where Snort’s operational settings are defined.
sudo nano /etc/snort/snort.conf - rules/: Directory containing various rule files Snort uses to detect specific traffic patterns.
- snort.conf or snort.lua (if you're using Kali): The main configuration file where Snort’s operational settings are defined.
- Task: Navigate to Snort’s Rules directory (usually
/etc/snort/rules) and view the contents.- Navigate:
cd /etc/snort/rules - List:
ls
- Navigate:
- Explain key configuration files:
A directory containing the Snort rules files. Files within typically follow a naming convention, like:
local.rules: Custom rules written by the user.community.rules: Community-contributed rules.Protocol-specificrules: like dns.rules, http.rules, icmp.rules, etc., for detecting protocol-specific patterns.preproc_rules: Contains configuration files for Snort’s preprocessors, which help in normalising or decoding traffic before rule inspection. Examples includefrag3.conf(for fragment reassembly) andsfportscan.conf(for port scanning).
-
Validating the Snort Configuration File
Before we start using Snort, let's make sure that our configuration file is valid. Testing the configuration file ensures that there are no syntax errors or misconfigurations that could prevent Snort from running correctly.
To test the configuration file, use the
-Toption. This flag tells Snort to run in test mode, where it checks the configuration file without actually starting the IDS/IPS process. The-coption specifies the configuration file path (in our case,snort.conf).Run the following command:
sudo snort -T -c /etc/snort/snort.conf
T: Enables test mode, which validates the configuration.c: Specifies the path to the configuration file. This allows you to use a different configuration file if needed by pointing to it with-c.
If the configuration file is correct, you’ll see a message indicating that Snort has successfully validated the configuration. If there are any errors, Snort will display them so you can troubleshoot.
Every time you start Snort, it will automatically display the default banner and initial setup information. You can suppress this display by using the
-qparameter.
Useful Snort Parameters
| Parameter | Description |
|---|---|
-V / --version | Displays version information about your Snort instance. |
-c | Specifies the configuration file to be used. |
-T | Runs Snort in self-test mode to check your setup without starting the IDS/IPS process. |
-q | Quiet mode; prevents Snort from displaying the default banner and initial setup information. |
Section-3: Running Snort in Sniffer Mode
Like tcpdump or Wireshark (from Network Protocals Module), Snort can be used in Sniffer mode with various flags to display different types of packet data. The table below explains the Sniffer mode parameters:
| Parameter | Description |
|---|---|
-v | Verbose mode. Displays the TCP/IP output in the console. |
-d | Displays the packet data (payload). |
-e | Displays the link-layer (TCP/IP/UDP/ICMP) headers. |
-X | Displays the full packet details in HEX. |
-i | Specifies a network interface to listen/sniff on. If multiple interfaces exist, choose one. |
Let's start using each parameter and observe the differences between them.
Sniffing with Parameter -i
To run the following command, you’ll need to identify the network adapter you want to sniff packets from, such as Wi-Fi or Ethernet. To find it, run ifconfig as shown below. Look for the adapter name associated with your IP address (e.g., enp0s3 in this example), though the name may vary based on your setup.
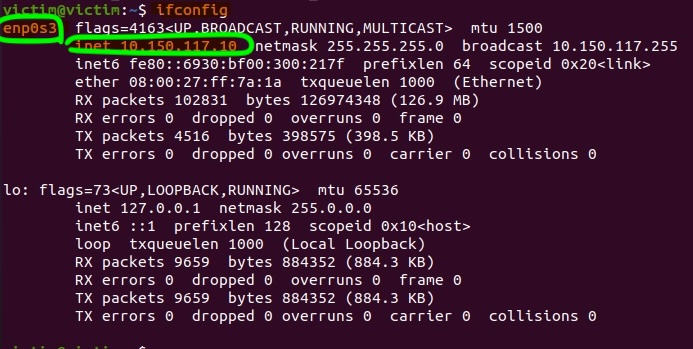
Start Snort in verbose mode (-v) on the interface Please add interface:
sudo snort -v -i enp0s3
Note: If you have only one interface, Snort will use it by default. In this example, we're explicitly setting it to
eth0.
Sniffing with Parameter -v
Start Snort in verbose mode:
sudo snort -v
Generate traffic: Next, try to generate ICMP traffic by pinging this machine from a different one. You should be able to see alerts corresponding to ICMP traffic in the Snort console. Alternatively, if you're using your own machine, try opening a webpage to generate HTTP traffic, and observe how different types of traffic are detected and logged. Snort will start displaying packets in verbose mode as follows:
As you can see, verbosity mode provides
tcpdump-like output. To stop sniffing, pressCTRL+C, and Snort will summarise the sniffed packets. to exit pressCTRL+X
Sniffing with Parameter -d
Start Snort in packet data display mode:
sudo snort -d
Now, create traffic again using ping (or if you're using your own machine, open a webpage, etc.). Snort will show packets in a more detailed view, including packet payload data.
In
-dmode, Snort includes payload data on top of what’s shown in verbose mode.
Sniffing with Parameter -de
Start Snort with both packet data (-d) and link-layer headers (-e):
sudo snort -d -e
After generating traffic with the using ping or HTTP, Snort will display both payload data and link-layer headers.
Sniffing with Parameter -X
Start Snort in full packet dump mode, displaying data in HEX:
sudo snort -X
Once the traffic is generated, Snort will display packets in HEX format, showing full details of each packet.
Section 4: Running Snort in Logger Mode
Snort can be used in Logger mode to log sniffed packets. By using packet logger mode parameters, Snort will automatically capture and log network traffic.
Packet Logger Parameters
| Parameter | Description |
|---|---|
-l | Logger mode. Specifies the target directory for log and alert output. Default is /var/log/snort. |
-K ASCII | Logs packets in ASCII format. |
-r | Reads dumped logs in Snort. |
-n | Specifies the number of packets to process or read before stopping. |
Let’s explore each parameter to see the differences. Note: Snort requires active traffic on the network interface, so generate traffic using the ping or web activities if you are using your own machine script.
Log File Ownership
Before generating logs, remember that Snort requires superuser (root/su) privileges to sniff traffic. When run with sudo, the "root" account owns the generated log files, so you may need elevated privileges to investigate them. There are two main ways to access these logs:
- Elevate privileges: Use
sudoto examine files, or switch to superuser mode withsudo su. - Change file ownership: Change file ownership with
sudo chown username fileorsudo chown username -R directoryfor recursive access.
Logging with -l
Run Snort in logger mode with:
sudo snort -dev -l "your path"
if you're using the victim machine, you can save it in the home dir:
sudo snort -dev -l /home/victim/
This logs packets in the current directory. You can configure the default output directory in snort.conf or use -l to specify a directory. This is useful for organising logs in different folders for testing.
Reading Generated Logs with -r
To read binary logs, use:
sudo snort -r logname
so if you kept the file in the home dir, your cmd would be :
sudo snort -r /home/victim/snort.log.17131939362
The number at the end of the file is random based on time so might not be the same.
Snort can read and display logs in a format similar to Sniffer mode. This parameter supports filters and formats like tcpdump or Wireshark.
Example Filters:
- Display HEX output:
sudo snort -r logname.log -X - Filter ICMP packets:
sudo snort -r logname.log icmp - Filter for UDP packets on port 53:
sudo snort -r logname.log 'udp and port 53'
Additionally, you can use the -n parameter to limit packet processing. For example, process only the first 10 packets with:
sudo snort -dvr logname.log -n 10
Section 5: Intrusion Detection Mode (Snort Rule Configuration and Testing)
Step 1: Understanding Snort Rules
A Snort rule is composed of:
-
Action: What Snort does if the rule matches (e.g.,
alert). -
Protocol: The protocol to match (e.g.,
icmp,tcp). -
Source/Destination: The IPs and ports involved.
-
Message: The message to display in the alert log.
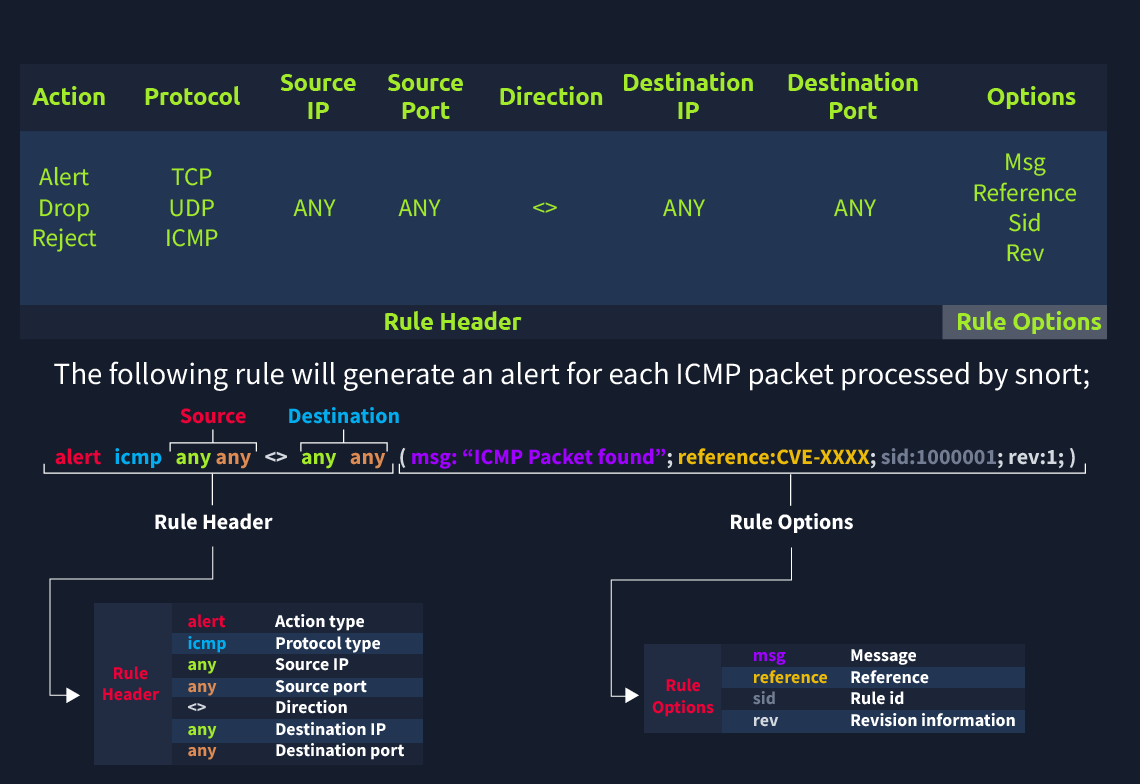
-
Each Snort rule must define an action, protocol, source and destination IP, source and destination port, and an optional rule component. By default, Snort operates in passive (IDS) mode; to enable IPS mode, you need to activate "inline mode."
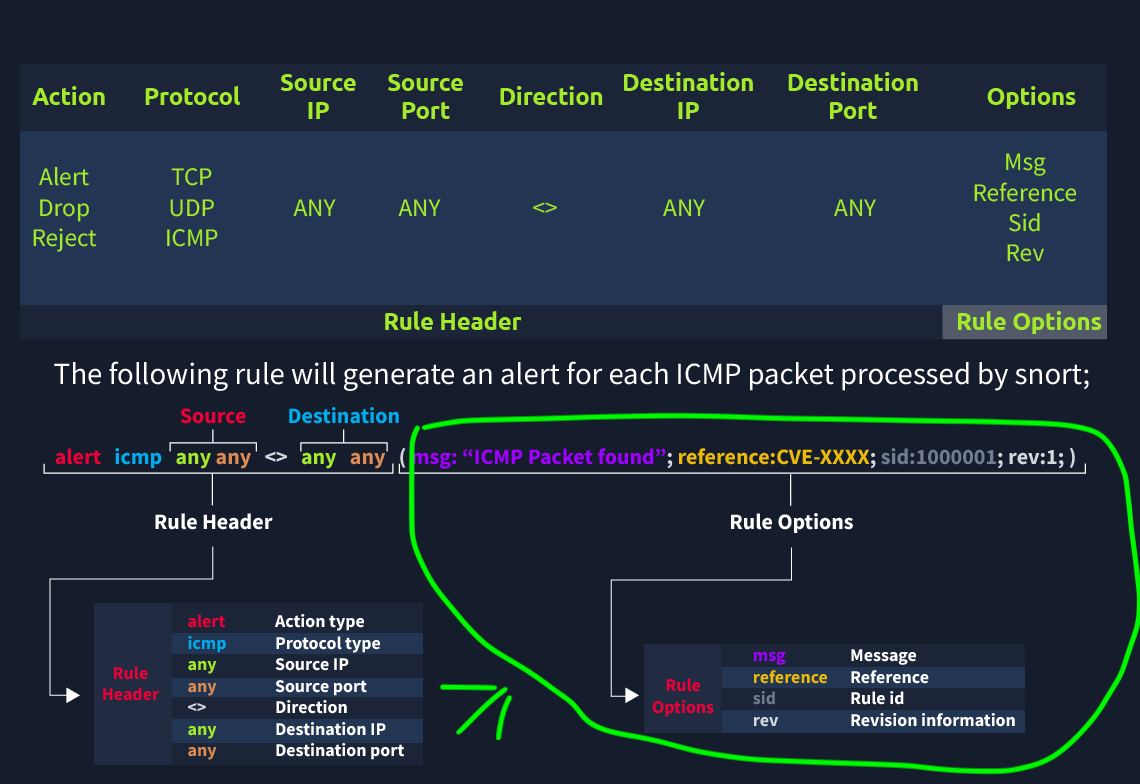
-
Creating efficient Snort rules requires familiarity with rule options and details, so practicing with various use cases is recommended. Here, we’ll cover the basics of Snort rule structure and explore two primary actions:
"alert"for IDS mode and"reject"for IPS mode.
-
While rule options are technically optional, they are essential for detecting complex attacks, as rules cannot function without a header.
| Category | Parameter | Description |
|---|---|---|
| Action | alert | Generates an alert and logs the packet. |
log | Logs the packet. | |
drop | Blocks and logs the packet. | |
reject | Blocks the packet, logs it, and terminates the session. | |
| Protocol | IP, TCP, UDP, ICMP | Specifies the protocol to filter for the rule. Snort supports only these four protocols natively. For example, to detect FTP traffic, use the TCP protocol on port 21. |
Task: Go throught table below and try to provide interpretation and type of filtering (Few should be enough)
| Filtering Type | Snort Rule | Description |
|---|---|---|
| IP Filtering | alert icmp 192.168.1.56 any <> any any (msg: "ICMP Packet From "; sid: 100001; rev:1;) | Creates an alert for each ICMP packet originating from the 192.168.1.56 IP address. |
| ?? | alert icmp 192.168.1.0/24 any <> any any (msg: "ICMP Packet Found"; sid: 100001; rev:1;) | Please provide interpretation. |
| ?? | alert icmp [192.168.1.0/24, 10.1.1.0/24] any <> any any (msg: "ICMP Packet Found"; sid: 100001; rev:1;) | Please provide interpretation. |
| ?? | alert icmp !192.168.1.0/24 any <> any any (msg: "ICMP Packet Found"; sid: 100001; rev:1;) | Please provide interpretation.. |
| ?? | alert tcp any any <> any 21 (msg: "FTP Port 21 Command Activity Detected"; sid: 100001; rev:1;) | Please provide interpretation. |
| ?? | alert tcp any any <> any !21 (msg: "Traffic Activity Without FTP Port 21 Command Channel"; sid: 100001; rev:1;) | Please provide interpretation. |
| ?? | alert tcp any any <> any 1:1024 (msg: "TCP 1-1024 System Port Activity"; sid: 100001; rev:1;) | Please provide interpretation. |
| ?? | alert tcp any any <> any :1024 (msg: "TCP 0-1024 System Port Activity"; sid: 100001; rev:1;) | Please provide interpretation. |
| ?? | alert tcp any any <> any 1025: (msg: "TCP Non-System Port Activity"; sid: 100001; rev:1;) | Please provide interpretation. |
| ?? | alert tcp any any <> any [21,23] (msg: "FTP and Telnet Port 21-23 Activity Detected"; sid: 100001; rev:1;) | Please provide interpretation. |
Click to view interpretations
| Filtering Type | Snort Rule | Description |
|---|---|---|
| Filter an IP range | alert icmp 192.168.1.0/24 any <> any any (msg: "ICMP Packet Found"; sid: 100001; rev:1;) | Creates an alert for each ICMP packet originating from the 192.168.1.0/24 subnet. |
| Filter multiple IP ranges | alert icmp [192.168.1.0/24, 10.1.1.0/24] any <> any any (msg: "ICMP Packet Found"; sid: 100001; rev:1;) | Creates an alert for each ICMP packet originating from the 192.168.1.0/24 and 10.1.1.0/24 subnets. |
| Exclude IP addresses/ranges | alert icmp !192.168.1.0/24 any <> any any (msg: "ICMP Packet Found"; sid: 100001; rev:1;) | Creates an alert for each ICMP packet not originating from the 192.168.1.0/24 subnet. |
| Port Filtering | alert tcp any any <> any 21 (msg: "FTP Port 21 Command Activity Detected"; sid: 100001; rev:1;) | Creates an alert for each TCP packet sent to port 21. |
| Exclude a specific port | alert tcp any any <> any !21 (msg: "Traffic Activity Without FTP Port 21 Command Channel"; sid: 100001; rev:1;) | Creates an alert for each TCP packet not sent to port 21. |
| Filter a port range (Type 1) | alert tcp any any <> any 1:1024 (msg: "TCP 1-1024 System Port Activity"; sid: 100001; rev:1;) | Creates an alert for each TCP packet sent to ports between 1-1024. |
| Filter a port range (Type 2) | alert tcp any any <> any :1024 (msg: "TCP 0-1024 System Port Activity"; sid: 100001; rev:1;) | Creates an alert for each TCP packet sent to ports less than or equal to 1024. |
| Filter a port range (Type 3) | alert tcp any any <> any 1025: (msg: "TCP Non-System Port Activity"; sid: 100001; rev:1;) | Creates an alert for each TCP packet sent to source port higher than or equal to 1025. |
| Filter specific ports | alert tcp any any <> any [21,23] (msg: "FTP and Telnet Port 21-23 Activity Detected"; sid: 100001; rev:1;) | Creates an alert for each TCP packet sent to ports 21 and 23. |
Step 2: Rules options
| Option | Description |
|---|---|
| msg | A quick identifier that appears in the console or log when the rule triggers. Provides a brief summary. |
| sid | Snort rule ID. Should be unique and >= 1,000,000 for user-created rules. Avoid overlap with reserved IDs. |
| reference | Additional information, such as CVE IDs, useful for incident investigation. |
| rev | Revision number for tracking rule updates. Helps analysts understand rule improvements over time. Version Control |
Example Rule:
alert icmp any any <> any any (msg: "ICMP Packet Found"; sid: 100001; reference:cve,CVE-XXXX; rev:1;)
Step 2: Payload options
| Option | Description |
|---|---|
| content | Matches specific payload data (ASCII or HEX). Multiple content options can be used in a rule, though more matches increase processing time. |
| nocase | Disables case sensitivity in content matching, useful for broader searches. |
| fast_pattern | Prioritises content search, speeding up the match operation. Recommended when using multiple content options. |
alert tcp any any <> any 80 (msg: "GET Request Found"; content:"GET"; fast_pattern; content:"www"; sid:100001; rev:1;)
Step 4: Non-Payload Detection Rule Options (FYI)
| Option | Description |
|---|---|
| id | Filters based on the IP ID field. |
| flags | Filters TCP flags, such as F (FIN), S (SYN), R (RST), P (PSH), A (ACK), U (URG). |
| dsize | Filters packet payload size. Specify a range (e.g., dsize:100<>300) or use greater/less than (dsize:>100). |
| sameip | Triggers if source and destination IPs are the same. |
Example Rules:
- ID Filtering:
alert tcp any any <> any any (msg: "ID TEST"; id:123456; sid: 100001; rev:1;) - TCP Flag Filtering:
alert tcp any any <> any any (msg: "FLAG TEST"; flags:S; sid: 100001; rev:1;) - Payload Size Filtering:
alert ip any any <> any any (msg: "SEQ TEST"; dsize:100<>300; sid: 100001; rev:1;) - Same IP Filtering:
alert ip any any <> any any (msg: "SAME-IP TEST"; sameip; sid: 100001; rev:1;)
Step 5: Setting Up the Rule
ICMP rule
1.. Navigate to the Rules Directory
Open a terminal on the victim machine (victim) and navigate to the Snort rules directory:
cd /etc/snort/rules
-
Edit the Local Rules File
Open thelocal.rulesfile using a text editor:sudo nano local.rules -
Add the ICMP Ping Rule
Add the following rule to detect ICMP echo requests (ping):alert icmp any any <> any any (msg:"FCS_Check_19133: ICMP Ping Detected"; sid:1000001; rev:1;)msg: Message to display in the alert.sid: A unique identifier for the rule.rev:1: version 1.
-
Save and Exit
Save the file (Ctrl+O, thenEnter) and exit the editor (Ctrl+X). -
Verify the Configuration
Test Snort to ensure there are no syntax errors:sudo snort -T -c /etc/snort/snort.confYou should get a long message saying that
Snort successfully validated the configration
Testing the Rule
-
Start the Snort Console: Open a terminal on the victim machine (victim) and start Snort in console mode, using the network interface you identified earlier with
ifconfigor ip a:sudo snort -A console -q -c /etc/snort/snort.conf -i enp0s3
-Aconsole: Displays alerts in the terminal.-qSuppresses extra output for a cleaner console.-c/etc/snort/snort.conf: Specifies the configuration file.-ienp0s3: Replace enp0s3 with the name of your network interface.
Snort will now wait for traffic and display alerts in the terminal.
-
Send a Ping Request From another machine (the Admin machine), send a ping to the victim machine. Open a terminal on the admin machine and run the following command:
ping <YOUR_IP_ADDRESS>
Replace <YOUR_IP_ADDRESS> with the IP address of the victim machine (where you defined the rule).
Now you should be able to see alerts with messages
Adding the SSH Detection Rule
Before testing, ensure the following rule is added to the local.rules file on the victim machine. This rule will trigger an alert whenever an SSH connection attempt is detected:
-
Navigate to the Rules Directory
Open a terminal and navigate to the Snort rules directory:cd /etc/snort/rules -
Edit the Local Rules File
Open thelocal.rulesfile for editing:sudo nano local.rules -
Add the SSH Detection Rule
Add the following rule to detect SSH connection attempts:alert tcp any any <> any 22 (msg:"FCS_19133_SSH Connection Attempt Detected"; sid:1000002; rev:1; flags:S; priority:3; content:"SSH"; nocase;)msg: Message displayed in the alert.sid: A unique identifier for the rule.flags:S: Matches TCP SYN packets (indicating a connection attempt).content:"SSH": Looks for the SSH protocol string in the packet.nocase: Makes the match case-insensitive.
-
Save and Exit
Save the file (Ctrl+O, thenEnter) and exit the editor (Ctrl+X). -
Verify the Configuration
Test Snort to ensure there are no syntax errors:sudo snort -T -c /etc/snort/snort.conf
Testing the Rule
-
Start the Snort Console
Open a terminal on the victim machine (victim) and start Snort in console mode, using the network interface you identified earlier withifconfigorip a:sudo snort -A console -q -c /etc/snort/snort.conf -i enp0s3-A console: Displays alerts in the terminal.-q: Suppresses extra output for a cleaner console.-c /etc/snort/snort.conf: Specifies the configuration file.-i enp0s3: Replaceenp0s3with the name of your network interface.
Snort will now wait for traffic and display alerts in the terminal.
-
Send an SSH Connection Attempt
From another machine (the admin machine), attempt to establish an SSH connection to the victim machine. Open a terminal on the admin machine and run the following command:ssh <USERNAME>@<VICTIM_IP_ADDRESS>- Replace
<USERNAME>with the SSH username on the victim machine (e.g.,victim). - Replace
<VICTIM_IP_ADDRESS>with the IP address of the victim machine.
You may get a prompt asking for a password or to accept the host key. Simply attempt the connection—there is no need to log in.
Now you should see alerts in the Snort console with messages indicating the detection of SSH traffic.
- Replace
Task: Detecting Nmap Scanning Activity
In this task, we will create a Snort rule to detect and alert on Nmap scanning activity. This is a common reconnaissance technique used by attackers, and detecting it is crucial in a security context.
Adding the Nmap Detection Rule
-
Navigate to the Rules Directory
Open a terminal and navigate to the Snort rules directory on the victim machine:cd /etc/snort/rules -
Edit the Local Rules File
Open thelocal.rulesfile for editing:sudo nano local.rules -
Add the Nmap Detection Rule
Add the following rule to detect Nmap scans:alert tcp any any <> any any (msg:"Nmap Scan Detected"; sid:1000003; rev:1; flags:S; threshold:type limit, track by_src, count 10, seconds 1; priority:2;)msg: Message displayed in the alert.sid: A unique identifier for the rule.flags:S: Matches TCP SYN packets (common in Nmap scans).threshold: Limits alerts to trigger if more than 10 SYN packets are sent by the same source within 1 second.priority: Sets the alert priority.
-
Save and Exit
Save the file (Ctrl+O, thenEnter) and exit the editor (Ctrl+X). -
Verify the Configuration
Test Snort to ensure there are no syntax errors:sudo snort -T -c /etc/snort/snort.conf
Testing the Rule
-
Start the Snort Console
On the victim machine, start Snort in console mode:sudo snort -A console -q -c /etc/snort/snort.conf -i enp0s3Replace
enp0s3with the name of your network interface.Snort will now monitor traffic and display alerts in the terminal.
-
Run an Nmap Scan
From the admin machine, perform an Nmap scan targeting the victim machine. Open a terminal on the admin machine and run the following command:nmap -sS <VICTIM_IP_ADDRESS>- Replace
<VICTIM_IP_ADDRESS>with the IP address of the victim machine. -sS: Performs a TCP SYN scan.
You can also try different scan types, such as
-sTfor a full TCP connect scan or-sUfor a UDP scan. - Replace
-
Check for Alerts
Switch back to the Snort console on the victim machine. You should see alerts like:[**] [1:1000003:1] Nmap Scan Detected [**]